welcome to continue our ESXtop series as part of course vSphere optimization & scale
in previous article we have got an overview about ESXtop utility and how to configure parameters
then we have seen how to use batch mode to capture data and how to analyze it with windows tool perfmon
this article will discuss how to monitory CPU in interactive mode : which is responsible to provide live value of ESXI performance
Using Interactive Mode
Since interactive mode is the default used by ESXTOP, >> then you don’t have to specify any extra commands to get into this mode,
simply type
ESXTOP
without any addition switches and you will get in “Interactive” mode.
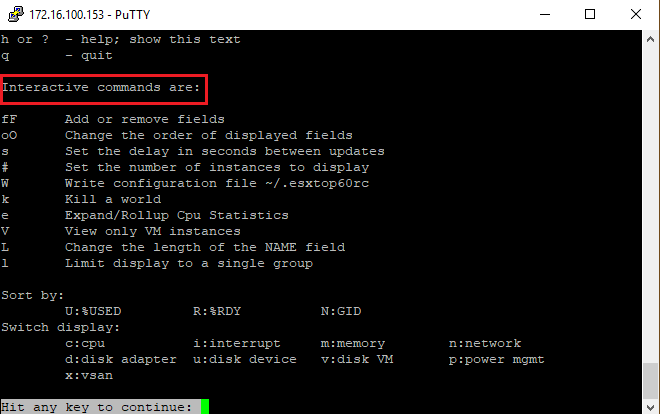
A good way to find your way around in interactive mode is by pressing “h”, this will give you a menu of the various commands available:
For Better View > Open Image in different TAB
as we know when ESXtop run >> it start with monitoring CPU performance
we can switch to monitor other vSphere resources using specific letters
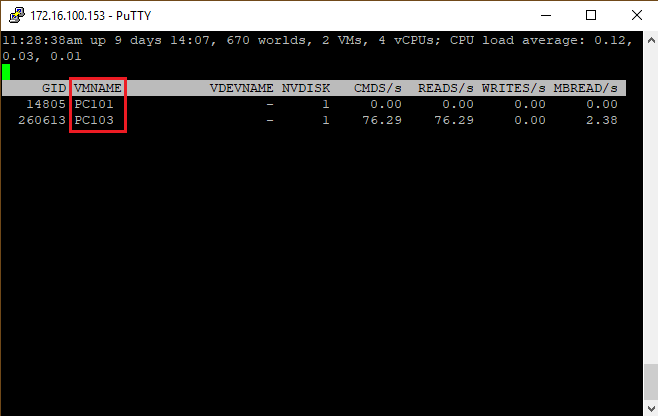
changing view
Changing views is straight forward , type the following keys for the associated views:
c = cpu
m = memory
n = network
i = interrupts
d = disk adapter
u = disk device
v = disk VM
p = power mgmt
r = rdma
x = vsan
ESXtop interactive Mode to monitor CPU
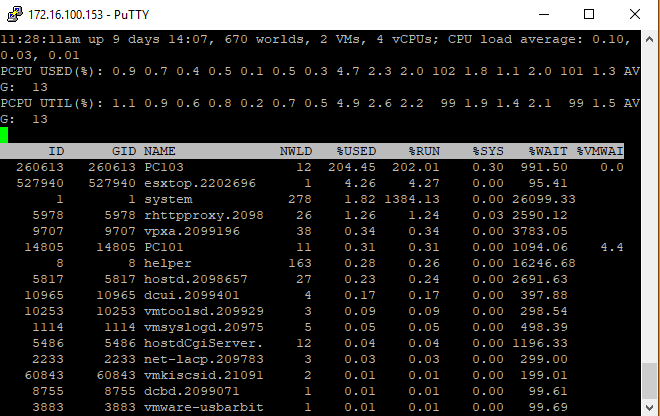
once you run ESXTop : it will get in interactive mode and start monitoring CPU
ESXtop monitor CPU from the following perspectives ”
CPU load averagerelates to the average CPU usage for the ESXi host over the last 1, 5 and 15 minutes. A load average of 0.5 suggests CPU is half utilised, 1.0 suggests CPU is fully utilised and a value above this would mean the ESXi host is using more physical CPUs than currently available.
%RDY column shows the percentage of time spent waiting for the CPU scheduler. Consider that 1% is roughly 200 milliseconds and 100% is roughly 20,000 milliseconds. Therefore a value between 5% and 10% or higher (or 1,000 to 2,000 milliseconds) could potentially be a cause for concern.
%USEDamount of time spent executing CPU core cycles by the virtual machine. A substantially higher value on one virtual machine compared with others could mean it is the cause of performance issues on the host.
%SYSshows the percentage of time spent performing system activities on behalf of the world. A value of 10% to 20% or higher could be a symptom of a high IO virtual machine.
%CSTP is a value for virtual machines with multiple vCPUs, and shows the time spent waiting for one or more of those virtual CPUs to become ready. If this is above 3% it generally means the number of vCPUs should be decreased.
%MLMTD percentage of time a ready to run vCPU was not scheduled due to a CPU limit setting. If this value is above 0 then the limit should be removed to improve performance.
%SWPWTrelates to the time spent waiting for swapped pages to be read from disk. If the value exceeds 5 you could potentially have an issue with memory over-commitment