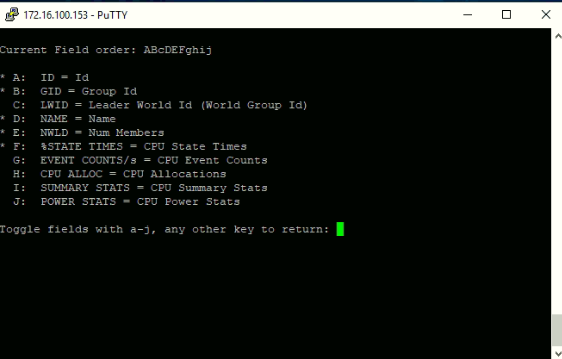
Please note that when a new VM is powered on, a VM is vMotion to the host or a new world is created it will not show up within esxtop when “-b” is used as the entities are locked! This behavior is similar to starting esxtop with “-l”.
For Better View > Open Image in different TAB
Analyzing results with perfmon
You can use multiple tools to analyze the captured data.
perfmon
excel
In networks pioneers we recommend tool perfmon for analyzing esxtop data
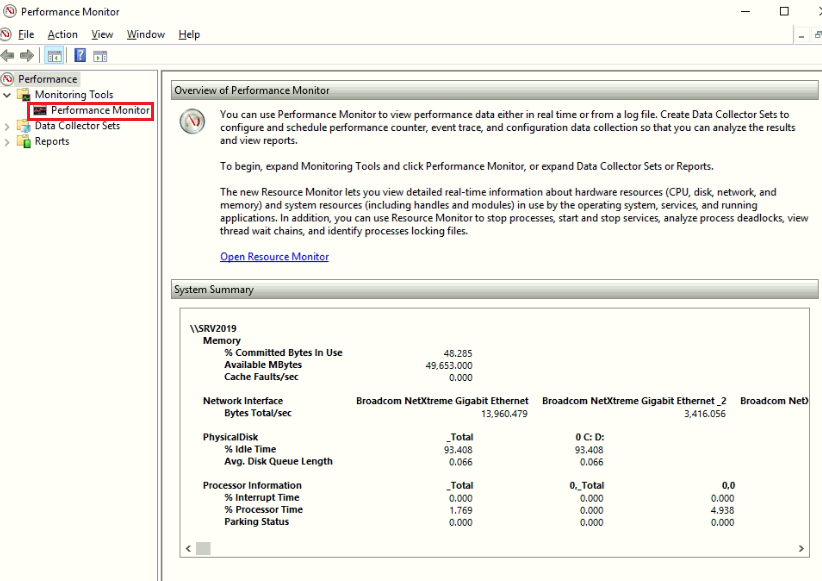
Perfmon is part of Windows which also known as “Performance Monitor
. You can import a CSV as follows:
Run: perfmon
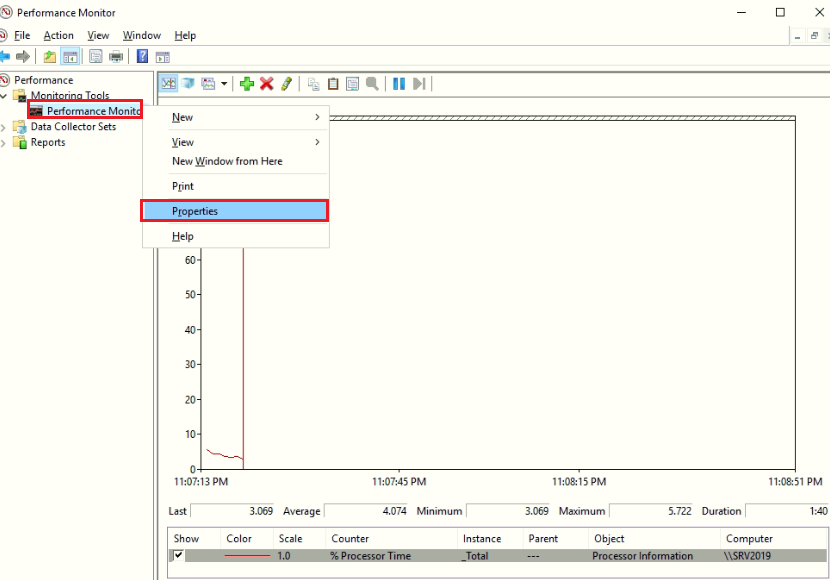
Right click on the graph and select “Properties”.
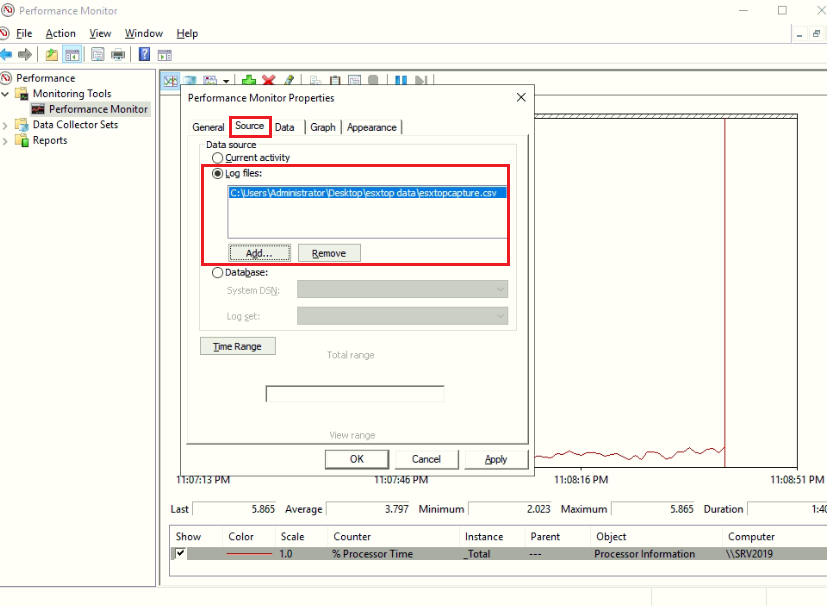
Select the “Source” tab.
Select the “Log files:” radio button from the “Data source” section.
Click the “Add” button.
Select the CSV file created by esxtop and click “OK”.
Click the “Apply” button.
Optionally: reduce the range of time over which the data will be displayed by using the sliders under the “Time Range” button.
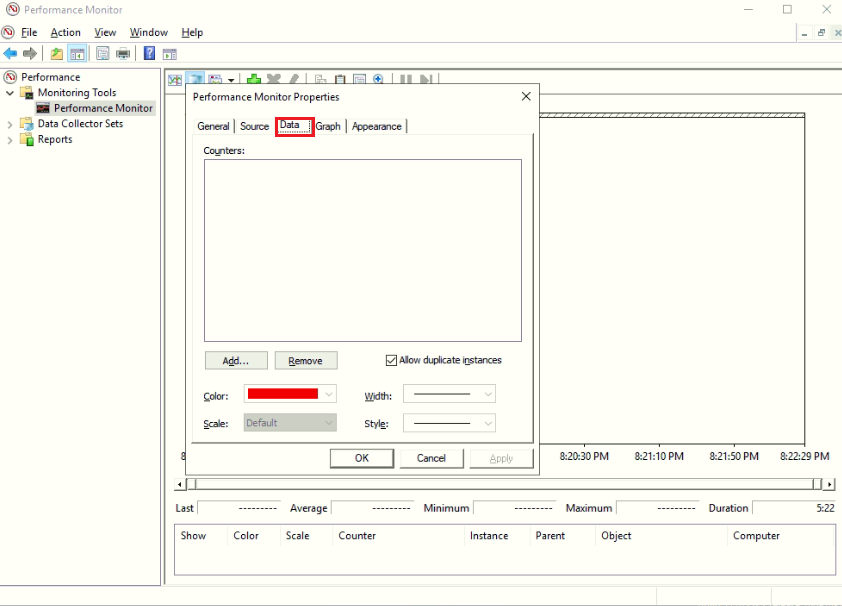
Select the “Data” tab.
Remove all Counters.
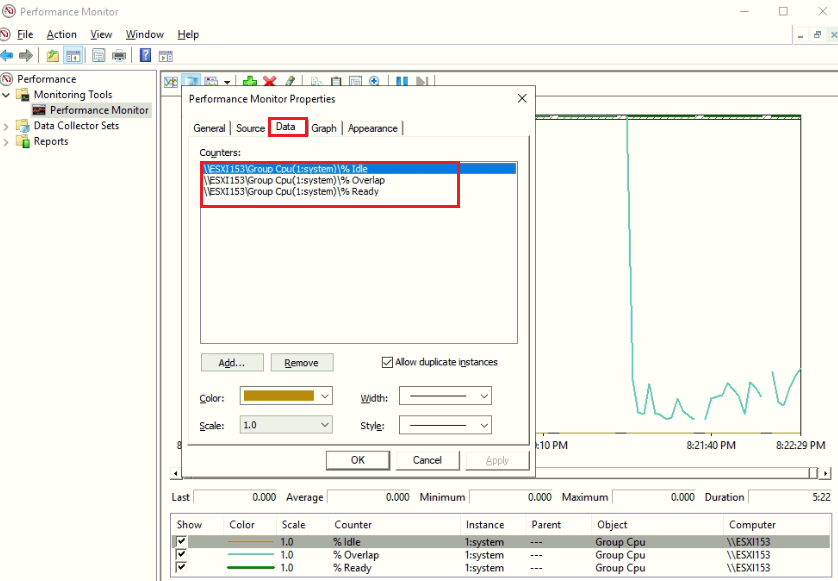
Click “Add” and select appropriate counters.
Click “OK”.
For Better View > Open Image in different TAB
For Better View > Open Image in different TAB
For Better View > Open Image in different TAB
For Better View > Open Image in different TAB
For Better View > Open Image in different TAB
For Better View > Open Image in different TAB
Analyzing results with Excel
MS Excel is also able to import the data as a CSV.
Keep in mind though that the amount of captured data is very huge so you might want to limit it by first importing it into perfmon and then select the correct timeframe and counters and export this to a CSV.
When you have done so you can import the CSV as follows:
Run: excel
Click on “Data”
Click “Import External Data” and click “Import Data”
Select “Text files” as “Files of Type”
Select File and click “Open”
Make sure “Delimited” is selected and click “Next”
Deselect “Tab” and select “Comma”
Click “Next” and “Finish”
All data should be imported and can be shaped / modelled / diagrammed as needed.
Conclusion
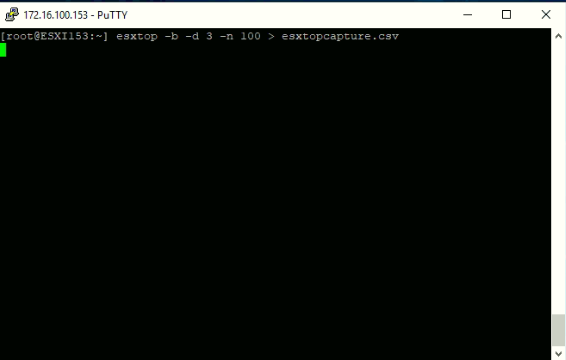
ESXtop in batch mode allow to capture data for analyzing
we highly recommend to use windows tools perfmon to analyze captured data
‘next article we will discuss how to use ESXtop interactive mode to monitor live performance of ESXI