in this article we will continue to use ESXtop to monitor storage in interactive mode
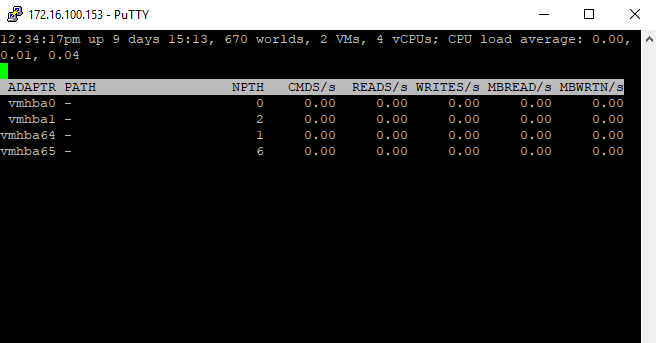
ESXtop to monitor storage HBA
Using the storage portion of ESXTOP, you can get very valuable information when troubleshooting storage performance
Start esxtop by typing esxtop at the command line.
Press d to switch to disk view (HBA mode).
To view the entire Device name, press SHIFT + L and enter 36 in Change the name field size.
Press f to modify the fields that are displayed.
Press b, c, d, e, h, and j to toggle the fields and press Enter.
Press s and then 2 to alter the update time to every 2 seconds and press Enter.
For Better View > Open Image in different TAB
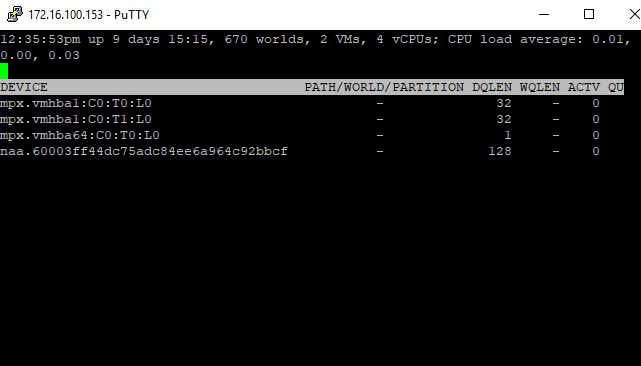
ESXtop to monitor storage LUN
For per LUN basis troubleshooting which I found very helpful in this case:
Start esxtop by typing esxtop from the command line.
Press u to switch to disk view (LUN mode).
Press f to modify the fields that are displayed.
Press b, c, f, and h to toggle the fields and press Enter.
Press s and then 2 to alter the update time to every 2 seconds and press Enter.
For Better View > Open Image in different TAB
ESXTOP storage Columns
There are (4) columns that really give a good bit of insight to latency issues in ESXTOP using the above monitoring configuration.
GAVG – Guest Average Latency is the total latency seen from a vSphere guest or your virtual machines. Also, a point to note is that GAVG is made up of the KAVG and DAVG.
KAVG – Kernel Average Latency is the time an I/O request is waiting in the vSphere storage stack
QAVG – Queue Average latency is the time spent waiting in a queue in the vSphere storage stack
DAVG – Device Average Latency is latency coming from the physical hardware, HBA and/or storage device
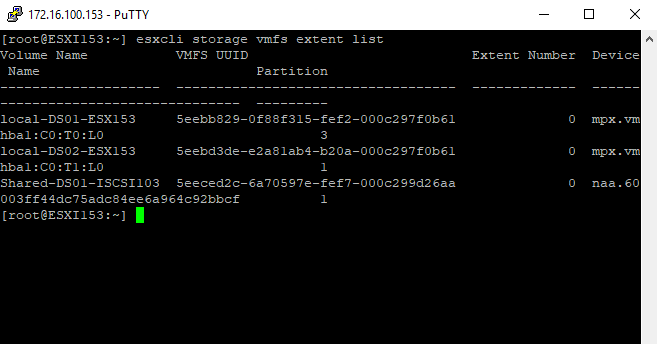
monitor storage with ESXcli
as we use ESXtop to monitor performance : also we can use the other command ESXcli to monitor storage performance