in this article we ill discuss how to use ESXtop interactive Mode to monitor Network
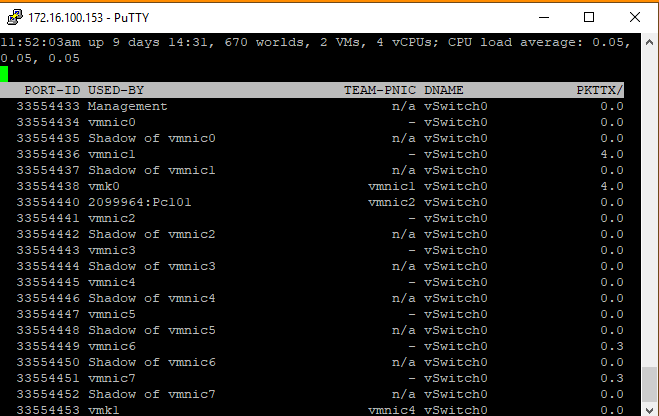
monitor network in interactive mode
Once in the esxtop screen press ‘n’ to display network statistics.
For network you can look at the %DRPTX and %DRPRX columns. These represent the dropped packets transmitted and dropped packets received respectively. Values above 0 here could signify high network utilisation.
The USED-BY and TEAM-PNIC columns display a list of the virtual machines on the host and the vmnic that it is using.
For Better View > Open Image in different TAB
For Better View > Open Image in different TAB
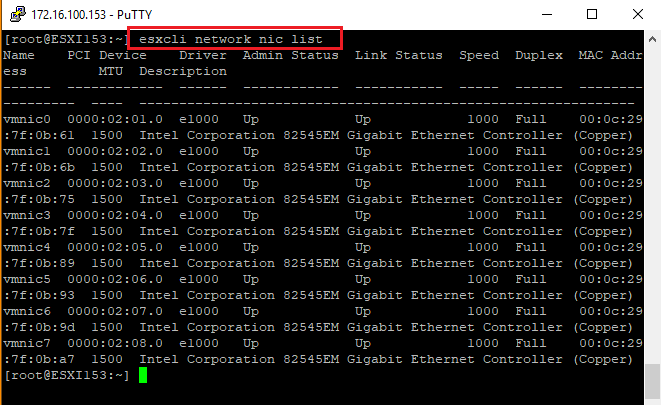
monitor network with command ESXcli
Also command line use esxcli to list the available network adapters
esxcli network nic list
To see the stats such as packets/bytes transmitted/received and dropped enter ‘esxcli network nic stats get –n vmnic0’ changing the vmnic as appropriate.