introduction
Perform manage Quality is the process of auditing the quality requirements and the results from quality control measurements to ensure that appropriate quality standards and operational definitions are used.
The key benefit of this process is that it facilitates the improvement of quality processes
manage quality facts
- considered as conformance work in cost of quality
- most of stakeholder are NOT concerned in Manage Quality like : sponsor , customer , management of performing organization
- Manage Quality provide an umbrella for (continuous process improvement )
- Manage Quality should answer questions like ;
- the requirements and standards and policies that have been created in plan quality management , are it intended to give us desired result
- the work we have planned in project management plan , does it the right work to satisfy customer
- the team who are performing work , are they following policies and standards
- project management team , do they follow standards and policies
- how to improve work that we are doing
manage quality concepts
true events:
- Two events occurring in the same trial.
mutually exclusive
- two events that cannot happen on the same trial.
اStatistical independence
- refers to two events not being linked.
Just in time
- refers to inventory levels.
Inspection :
- Quality cannot be inspected in; you must plan for and execute a quality strategy. Increasing inspection is the LEAST factor to improve quality
- Inspections may be conducted at any level, including the project team, and at any time throughout the development of the product. They are used to prevent defects from being delivered to the customer
quality management inputs-techniques-outputs
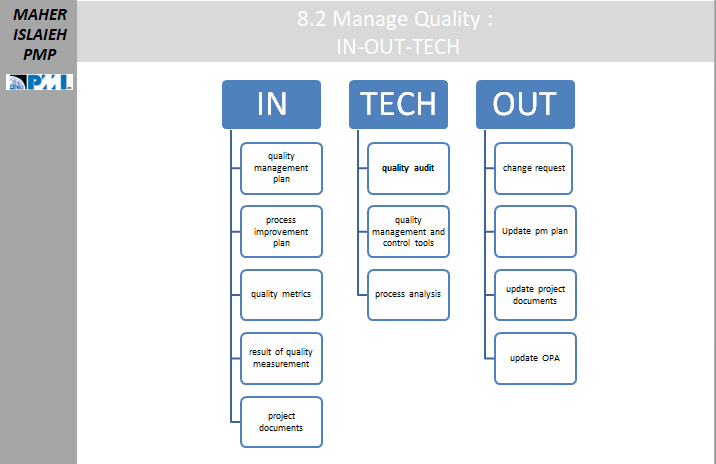
Inputs
- quality management plan
- process improvement plan
- quality metrics
- result of quality measurement
- project documents
Techniques
- quality audit
- quality management and control tools
- process analysis
Outputs
- change request
- Update pm plan
- update project documents
- update OPA
Manage Quality: Inputs
Manage Quality: Inputs
Project Management Plan
The component of the project management plan that is an input for this process is the quality management plan, which is the output of process 8.1 Plan Quality Management. In the quality management plan, you find a description of:
- the acceptable level of project and product quality
- how to ensure this level of quality in the deliverables and processes
- what to do with nonconforming products, including what corrective actions to implement
Project Documents
The projects documents that may be inputs to this process include the following (these are listed by knowledge area)
1- Integration Knowledge Area
- Lessons learned register–if lessons are learned during the process 8.2 Manage Quality which improve the efficiency and effectiveness of managing quality, then the register is updated with these lessons so they can be applied to later phases in the project.
2- Quality Knowledge Area
- Quality metrics–created as an output of process 8.1 Plan Quality Management, quality metrics are the basis for testing the deliverables of a project
- Quality control measurements–an output of process 8.3 Control Quality, quality control measurements, which measure the quality of the results from the project, can be used to evaluate the quality of the processes, particularly those that create quality control measurements.
3- Risk Knowledge Area
- Risk report–created as an output of 11.1 Identify Risks, this identifies sources of overall project risk, and can be used to identify those elements of risk exposure which can impact the quality objectives of a project.
Organizational Process Assets
Here are the organizational process assets that may be inputs to this process.
- The organizational quality management system that includes policies, procedures and guidelines which respect to qualitiy (and which should be incorporated into the Qualitiy Management Plan).
- Quality templates such as check sheets, traceability matrix, test plans and documents that will be used with tools and techniques of this process
- Lessons learned repository with information on quality assurance activities that were done on previous similar projects
Quality Management Tools
Quality Management Tools
- Process Decision Program Chart PDPC
- Interrelation Graphs
- Tree Diagram
- Prioritization Matrix
- Activity Network Diagram
- Matrix Diagram
Manage Quality: Tools and Techniques
Manage Quality: Tools and Techniques
Data Gathering
- Quality checklists–these verify that a set of required steps have been performed or to see if a list of requirements has been satisfied. These checklists are usually based on the acceptance criteria included in the scope baseline.
Data Analysis
- Alternatives analysis–used to identify various options or approaches with respect to quality and then to select which are most appropriate for use on this project
1- Document analysis
this analyzes the following documents to point out processes that may be out of control
- Quality reports
- Test reports
- Performance reports
- Variance analysis
2- Process analysis
identifies opportunities for process improvements (see paragraph 8.2.2.8 Quality Improvement Methods) by examining
- the inputs to a process to see if there are constraints they impose on the process
- non-value-added activities that occur during that process
- the outputs to a process to see if they can be used to identify problems
3- Root cause analysis
- an analytical technique used to determine the basic underlying reason that causes a variance, defect, or risk. It can also identify the root causes of a problem on the project (sometimes referred to as an “issue”).
Decision Making
- If there are alternatives being discussed (see “alternatives analysis” in paragraph 8.2.2.2 on Data Analysis techniques), then there needs to be a decision-making process put into place to decide among those alternatives. Having criteria in place is important so that the various alternatives can be evaluating to narrow down the alternatives that are the most viable for the project. if necessary, the final decision can be made by votes taken at a meeting of project team members and experts.
Data Representation
Here are some techniques used to represent data–they are used in conjunction with the data analysis techniques listed in paragraph 8.2.2.2.
- Affinity diagrams–these organize potential causes of defects into groups showing areas that should be focused on the most. For more information on this techique, see the post I did for the 5th Edition PMBOK just on this technique alone.
- Cause-and-effect diagrams–these are sometimes known as fishbone diagrams, why-why diagrams, or Ishikawa diagrams, and are used to identify the root cause of the the problem being stated. This kind of diagram breaks down the potential causes of the problem statement into discrete branches. See Figure 8-9 on p. 294 of the PMBOK Guide for an example.
- Flowcharts–used to show a series of steps that lead to a defect and are used in conjunction with process analysis (see paragraph 8.2.2.2 on Data Analysis techniques) to identify the processes that are causing the defect so that those processes can be improved using quality improvement methods (see paragraph 8.2.2.8)..
- Histograms–these are graphical representations of historical data. Used in managing quality, they can show the number of defects per deliverable, for example. Then the deliverables that have the most defects can be identified and worked on as a priority.
- Matrix diagrams–these show the strength of relationships among factors, causes, and objectives that exist between the rows and columns that form the matrix. For an example of a quality tool called House of Quality that uses matrix diagrams, see my post below:
- Scatter diagrams–this shows the relationship between two variables. If there is no relationship between the two variables, there will be no discernible pattern between the data points in the diagram. If there is a positive correlation, there will be an upward-sloping pattern to the data points; if there is a negative correlation, there will be a downward-sloping pattern. Do not confuse a negative correlation with no correlation at all! If X increases while Y increases, this is a positive correlation because the tendency is the same with both variables. However, if X decreases while Y increases, this is a negative correlation because the tendency is the opposite between the two variables. If there is NO correlation, then as X increases, Y may be all over the place rather than having any particular pattern.
Audits
An audit is a structured, independent process used to determine if project activities comply with organizational and project policies, processes, and procedures. It is structured because it is done based on some sort of organized format such as a checklist (see paragraph on 8.2.2.1 Checklists). It is independent because it is not being done by the same people who are responsible for doing the project activities. This is why a quality audit is usually conducted by a team external to the project. Here are the types of things that a quality audit will look for:
- Identification of good and best practices being implemented, and sharing of good practices being done in similar projects in the organization
- Identification of nonconformity, gaps and shortcomings between activities as they are being done on the project and how they are supposed to be done based on project procedures set forth in the Project Management Plan.
- Offering assistance to improve the implementation of processes (see paragraph 8.2.2.8 Quality Improvement Methods)
- Besides looking at project activities, quality audits can also confirm that approved change requests have been implemented correctly.
Design For X (sometimes abbreviated as DfX)
- This is a set of technical guidelines that may be applied during the design of a product for the optimization of a specific aspect of the design. hat is the “X” in DfX, and it can refer to reliability, safety, usability, or any other feature of the design that you want to focus on. This is a trending topic in quality in PMI, which is designing in quality so that defects don’t get produced in the first place, rather than trying to reduce defects through inspection later on.
Problem Solving
- Quality assurance and quality improvement requires problem solving, where you have to find the cause of the defect (the problem), generate possible solutions, choose one of those solutions, and then implement it. Finally, you have to verify that the solution is effective.
Quality Improvement Methods
- Quality improvements can be based on recommendations from quality control processes (i.e., as an output to process 8.3 Control Quality), or they can be uncovered during this process 8.2 Manage Quality. No matter where these suggestions for quality improvement come from, methods such as Six Sigma can be used to implement them.
Manage Quality Outputs
Manage Quality Outputs
Quality Reports
The information contained in the quality reports is to used by the project team in order to take corrective actions, either to the processes themselves or to the product. The information may include the following:
- Quality management issues escalated by the project team
- Recommendations for improvements to the processes of the project or to the product itself to reduce the probability of potential defects (preventive actions)
- Recommendations for corrective actions to detect defects (inspection, testing, etc.) or to repair defects before they go to the customer (rework/scrap).
- Summary of findings from the Control Quality process.
These quality reports are then distributed to all stakeholders who are interested in quality and/or those who have influence on quality.
Test and Evaluation Documents
These are the documents which are to be used in the next process 8.3 Control Quality. They may include:
- Checklists (to make sure that all processes are done correctly)
- Check sheets (to document any results that are nonconforming to the quality standards)
- Requirements traceability matrices (to trace quality metrics to the specific requirements they measure)
Change Requests
As a result of this process, there may be recommendations for changes to the following:
- Project management plan (particularly the quality management plan or any of the baselines for scope, schedule, and cost–see paragraph 8.2.3.4 below)
- Project documents (particularly the issue log, lessons learned register, or the risk register–see paragraph 8.2.3.5 below)
- Project or product management processes (as a result of quality improvement activities)
These are then made inputs to process 4.6 Perform Integrated Change Control.
Project Management Plan Updates
- Quality management plan–sometimes rather than conforming the results to the plan, you may find that the plan was unrealistic, in which case you may need to modified the agreed-upon approach to managing quality based on the actual results.
- Scope baseline–specific quality management activities may change the deliverables (found in the project scope statement) or to the work packages (found in the WBS)
- Schedule baseline–specific quality management activities may impact the schedule, in which case the schedule baseline may need to be changed
- Cost baseline–specific quality management activities may impact the budget, in which case the cost baseline may need to be changed.
Project Documents Updates
- Issue log–as a result of the audits done as part of the quality assurance process, new issues may be raised which are recorded in the issue log.
- Lessons learned register–information is added to the register on
- challenges encountered during this quality management process and how they could have been avoided or
- approaches that worked well for managing quality
- Risk register–information on new risks identified during this process are recorded in the risk register to be managed using the risk management processes