introduction
Plan Quality Management is the process of identifying quality requirements and/or standards for the project and its deliverables, and documenting how the project will demonstrate compliance with relevant quality requirements.
The key benefit of this process is that it provides guidance and direction on how quality will be managed and validated throughout the project
what is quality plan
A quality plan is a document, or several documents, that together specify quality standards, practices, resources, specifications, and the sequence of activities relevant to a particular product, service, project, or contract. Quality plans should define:
- Objectives to be attained (for example, characteristics or specifications, uniformity, effectiveness, aesthetics, cycle time, cost, natural resources, utilization, yield, dependability, and so on)
- Steps in the processes that constitute the operating practice or procedures of the organization
- Allocation of responsibilities, authority, and resources during the different phases of the process or project
- Specific documented standards, practices, procedures, and instructions to be applied
- Suitable testing, inspection, examination, and audit programs at appropriate stages
- A documented procedure for changes and modifications to a quality plan as a process is improved
- A method for measuring the achievement of the quality objectives
- Other actions necessary to meet the objective
Quality standards
Quality standards can generally be categorized as follows:
- Internal company standards
- Those imposed by regulatory agencies
- Legal standard of care to the public (or simply, public expectations)
- External standards imposed by the project sponsor or organization
- Other stakeholder standards, like utilities, adjacent landowners, and other affected organizations
we have explained in previous article of quality management how project manager get quality standards
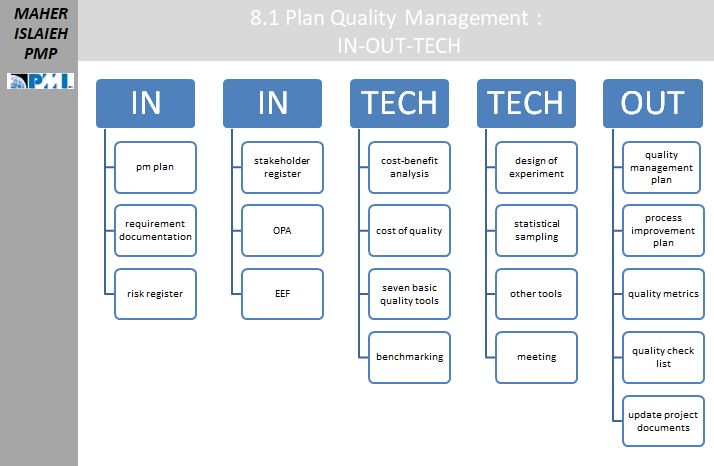
Plan Quality Management : inputs-techniques-outputs
Plan Quality Management : inputs-techniques-outputs
Inputs
- pm plan
- requirement documentation
- risk register
- stakeholder register
- OPA
- EEF
Techniques
- cost-benefit analysis
- cost of quality
- seven basic quality tools
- benchmarking
- design of experiment
- statistical sampling
- other tools
- meeting
Outputs
- quality management plan
- process improvement plan
- quality metrics
- quality check list
- update project documents
Seven Basic Quality Tools
Cause and Effect Diagram (called Fishbone , Ishikawa)
- using “WHY” and tracing problem until to detect cause ,
- it’s used to organize thought and generate discussion
- useful to eliminate problem founded in control chart
- The fishbone diagram is a tool to help stimulate thinking, to create an atmosphere conducive to open sharing of thoughts, and to gather thoughts in a cohesive way.
- can be used during monitoring and controlling to determine the cause of defects
Flowchart(called process maps )
- show consequence steps and branching possibilities in to process to transform inputs to outputs
- useful in understanding and estimating cost of quality
- using workflow to estimate Expected monetary value EMV for conformance and NON conformance work
Check Sheet (tally )
- useful in gathering data and attribute data while inspection if defect
- often data collected are used in PARETO diagram
- should be distinguished of “quality checklist ” as output of plan quality management process which list item to be inspected or even list of steps to be performed
PARETO diagram
- another type of bar chart
- help in focus on most critical issues
- using XY diagram to prioritize the most significant problem cause
- rule (80/20) 80% is issues are cause by 20% of factors
Histogram Chart
- – special form of BAR chart
- used to describe central tendency and dispersion of statistical distribution
- does NOT concern time in diagram or cause of problem , also there is NO prioritization
- display data in columns or bar
Control Chart
- used to determine if process is stable or NOT , and if it has predictable performance
- project manager should determine in advance (in quality management plan ) the following : mean , control limit , specifications limits
- upper and lower limit : are set by agreement to define allowed values
- mean : is average of data , represented by dash line
- specification limits is set by customer and could be within or out control limits (in exam is outside control limits )
- control limit is determined by using standard calculation to identify the point when preventive action needed
- generally control limit is set to -+3isgma , but sometimes set to -+6 sigma
- process is considered out of control when DATA point exceed control limit or seven consequence(NOT random) data point above or below main limit, which lead project manager to use additional tools like (cause and effect diagram ) to inspect the special cause (sometimes called assignable effect)
- out of control is considered lack of consistency or NOT predictable in process
scatter diagram (correlation)
- XY diagram
- track two variable to decide if they related or NOT
- seek to explain change in dependent variables Y
- X could by positive , Zero, Or negative
output : Quality Management Plan
Quality Management Plan
- define standards for project : please see how to get standards
- define work to be done to come up with these standards
- determine responsibilities : who will perform standards , who will approve it
- determine acceptance criteria (metrics)
- how project management activities should be done
output : Process Improvement Plan
Process Improvement Plan
detail steps and identify activities that enhance processes values , like
- process boundaries
- process configuration
- process metrics
- quality metrics
- quality checklist
describe product or project attribute and how CQ will measure it
decide what measurement is acceptable