introduction
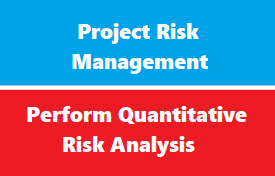
Perform Quantitative Risk Analysis is the process of numerically analyzing the effect of identified risks on overall project objectives.
The key benefit of this process is that it produces quantitative risk information to support decision making in order to reduce project uncertainty. The inputs, tools and techniques,
objectives of quantitative risk analysis
perform quantitative risk analysis involve numerically analyze probability and impact of risk (giving money value to consequences ) .
perform quantitative risk analysis aim to:
- reduce uncertainty and focus of high priority risks
- determine project risk at all
- estimate cost and schedule reserve (contingency and management )
- determine quantified percentage of achieving project objective
- E.g. (we have 80% to finish project before 6 months )
- determine which risk need more attention
- determine risk that need to plan response
- create achievable cost target , schedule target , and scope target
methods of determine quantitative probability and impact :
methods of determine quantitative probability and impact :
- interviewing
- cost and time estimating
- Delphi techniques
- use historical record from previous project
- expert judgment
- sensitivity analyses
- expected monetary value EMV
- Monty Carlo analysis
- decision tree
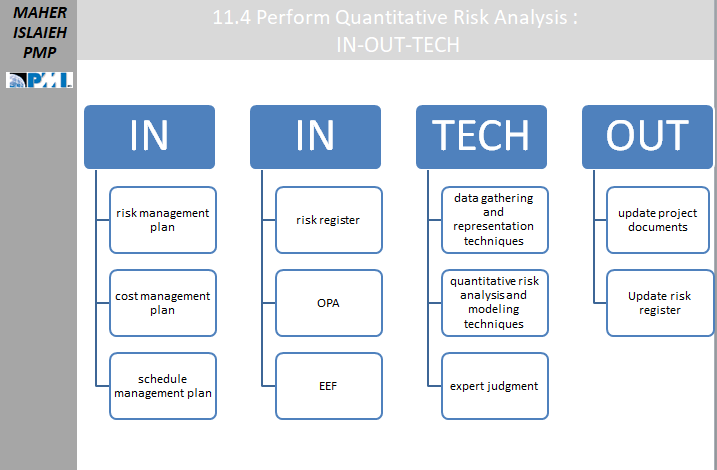
process inputs - techniques - outputs
Inputs
- risk management plan
- cost management plan
- schedule management plan
- risk register
- OPA
- EEF
Techniques
- data gathering and representation techniques
- quantitative risk analysis and modeling techniques
- expert judgment
Outputs
- update project documents
- Update risk register
process inputs
Perform Quantitative Risk Analysis: Inputs
Project Management Plan
The components of the project management plan that are used as inputs consist of a) the risk management plan component and the baselines for the three basic constraints of scope, time and cost.
- Risk management–the risk management plan should indicate whether the project is of sufficient size and complexity to warrant the time, cost and human energy spent in doing a quantitative risk analysis.
- Scope, schedule and cost baseline–these baselines give the starting point for evaluating individual project risks and other sources of uncertainty. For example, any activity identified in the scope baseline component of the Work Breakdown Structure as being on the critical path should automatically be scrutinized as being higher risk because any delay in that activity will cause a delay in the entire project.
Project Documents
The PMBOK® Guide lists these in alphabetical order, but I am listing them below according to their category to make the list easier to comprehend.
Documents related to basic constraints and assumptions
- Assumption log–assumptions that pose a risk to project objectives should be examined as well as the effect of basic constraints of the scope, time and cost
- Milestone list–these define the schedule targets against which the results of a quantitative schedule risk analysis are compared (for example, a finding that there is 80% confidence in achieving the project deadline)
- Resource requirements–the required resources (both human resources and physical resources) can provide a starting point from which variability is evaluated. For example, the delivery date of required key physical resources or the availability dates for key human resources would create risks to the project objectives if they are not adhered to.
Documents related to estimates
- Basis of estimates–this provides background on the estimate’s accuracy, methodology, and source of information.
- Cost estimates, duration estimates–three-point estimates which give the most likely estimate, as well as the optimistic and pessimistic estimates based on the triggering of certain risks, provide a starting point for the modeling of qualitative risk analysis.
Documents related to forecasts
- Cost forecast, schedule forecast–cost and schedule forecasts using earned value management such as the Estimate to Complete (ETC), the Budget at Completion (BAC), and the To-Complete Performance Index (TCPI) may be used in conjunction with quantitative risk analysis to determine the confidence level of achieving those targets.
Documents related to risks
- Risk register–this will include details of individual project risks to be used as input for the quantitative risk analysis done in this process.
- Risk report–this risk report describes sources of overall project risk (which can be found in the project charter)
Enterprise Environmental Factors
- Industry studies of similar projects
- Published material, such as commercial risk databases or checklists.
Organizational Process Assets
- Information from previous similar projects done by the organization.
process Tools and Techniques
Perform Quantitative Risk Analysis: Tools and Techniques
Expert Judgment
Expertise should be considered form those people who have specialized knowledge regarding the quantitative analysis of risks. In particular, those who know about:
- Translating the information on individual project risks in terms of probability and impact into numeric inputs for the quantitative risk analysis model using a tool called Earned Monetary Value.
- Selecting the most appropriate representation of uncertainty to model particular risks. You are familiar with the triangular and beta distributions from the concept of three-point estimates. There are other distributions that are possible and an expert will know what is the most appropriate for the project at hand and know how to work with them.
- Which of the modeling techniques are most suitable for use on the project (simulation, sensitivity analysis, decision tree analysis, and/or influence diagrams).
- Interpreting the outputs of quantitative risk analysis and preparing them for inclusion in the risk register and risk report.
Data Gathering
- Interviews are the main form of technique used to gather data from the experts mentioned above.
Interpersonal and Team Skills
Although individual interviews with experts are helpful, with a complex topic like risk analysis it is often extremely beneficial to have a dedicated risk workshop, and this is where the skill of facilitation of such a workshop comes into play. A facilitator needs to help do the following:
- Establish a clear understanding of the purpose of the workshop
- Build consensus among participants
- Ensure continued focus on the task, especially if someone talks about something which is not in the scope of the workshop
- Use creative approaches to deal with interpersonal conflict or to uncover sources of bias.
process outputs
Perform Quantitative Risk Analysis: Outputs
Assessment of overall project risk exposure
- Chances of project success, measured by the probability that the project will achieve its key objectives (deadline or other interim milestones, required cost target, etc.)
- Degree of variability remaining within the project, indicated by the range of possible project outcomes (related to the largest individual risks that are indicated by the sensitivity analysis tool/technique).
Detailed probabilistic analysis of the project
- Amount of contingency reserve needed to provide a specified level of confidence
- Identification of individual project risks or other sources of uncertainty that have the greatest effect on the project critical path.
- Major drivers of overall project risk.
Prioritized list of individual project risks–
- Using sensitivity analysis, you identify those project risks that pose the greatest opportunity to the project.
Trends in quantitative risk analysis results
- you take this same quantitative risk analysis output and update it during the project if there are any changes either in probability or impact of the largest individual project risks. In this way, you can chart the trends in quantitative risk analysis results. For example, if a major individual risk is not triggered during the project, then this has an effect of lowering the overall project risk because that individual risk was a big contributor to the total risk. Or if the probability of a risk increases, this may have an effect of increasing the overall project risk. The trends may show where it is important to spend the effort in developing risk responses.
Recommended risk responses
- based on the results of the quantitative risk analysis, the risk report may present suggested responses to the level of overall individual risk exposure or key individual project risks, thus giving valuable input to the next process