introduction
Control Schedule is the process of monitoring the status of project activities to update project progress and manage changes to the schedule baseline to achieve the plan.
The key benefit of this process is that it provides the means to recognize deviation from the plan and take corrective and preventive actions and thus minimize risk.
The status of activities, resources, and work force utilization provide measurement standards for determining schedule variance.
The project manager utilizes these tools to implement integrated project changes to help restore schedule performance
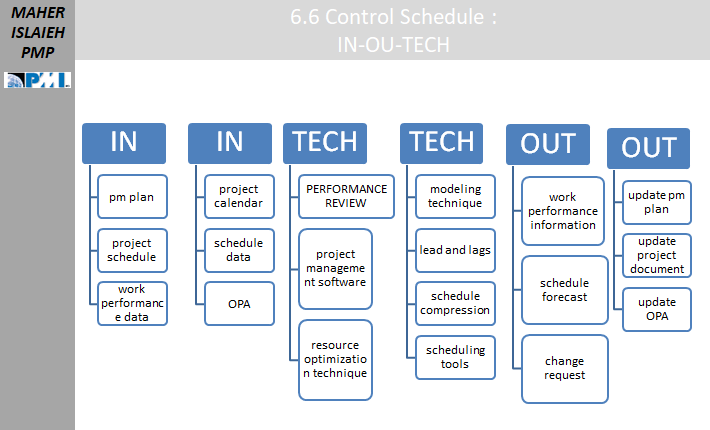
control schedule : inputs - techniques - outputs
Inputs
- pm plan
- project schedule
- work performance data
- project calendar
- schedule data
- OPA
Techniques
- PERFORMANCE REVIEW
- project management software
- resource optimization technique
- modeling technique
- lead and lags
- schedule compression
- scheduling tools
Outputs
- work performance information
- schedule forecast
- change request
- update pm plan
- update project document
- update OPA
Control Schedule: Inputs
Project Management Plan
The project management plan consists 9 knowledge area plans +9 subsidiary plans for requirements, change and configuration management, ) project baselines for the major constraints of scope, schedule, and cost.
The elements that are inputs to this process include:
Schedule management
- plan–this plan, which is the output of the process 6.1 Plan Schedule Management, contains guidelines on how to do all of the other processes, including this one of 6.6 Control Schedule. Such guidelines include:
Schedule baseline
- created in the process 6.5 Develop Schedule, the current version of the schedule model is referred to as the schedule baseline and it is the plan against which the actual results will be compared to see if there is a variance.
Performance measurement baseline
- using Earned Value Analysis, you can calculate a measure of how well the project is doing, either a Schedule Performance Index (SPI) or the Schedule Variance (SV).
Scope baseline
- This is actually three documents in one:
- the project scope statement (which breaks down the scope from the requirements to the level of deliverables which fulfill those requirements),
- the WBS (or Work Breakdown Structure, which further breaks down the scope from the level of deliverables to that of work packages, whose completion you will be monitoring as a part of this process, and
- the WBS dictionary, which contains information about the work packages such as the duration estimates, also used in monitoring as a part of this process.
Project Documents
The project documents used as inputs to this process are (these are arranged by knowledge area Integration Knowledge Area )
- Lessons learned register–created as an output of 4.4 Manage Project Knowledge, this is updated in many processes so any lessons learned early on in the project can benefit you later on; in this case, to improve schedule control.
Schedule Knowledge Area
- Schedule data–particularly the inputs to the schedule model such as the scheduled activities and their attributes, which may end up being updated as a result of this process. These are processed by the Project Management Information System tool (such as Microsoft Project) to create the project schedule.
- Project schedule–the output of the schedule model, particularly the most recent version referred to as the schedule baseline.
- Project calendars–these are the calendars that show the working shifts when resources are available to work on the project. These are the general calendars that affect the company as a whole, for more specific calendars for each resource, see the “resource calendar” document below.
Resources Knowledge Area
- This is an output of 9.2 Estimate Activity Resources and shows the availability of physical and human resources to be used on the project.
Work Performance Data
An output of process 4.3 Direct and Manage Project Work, this shows for the reporting period in question
- which activities have started
- the progress of activities (their actual duration so far, remaining duration, and percent complete)
- which activities have completed
This data will be compared to the schedule baseline to see if there is a variance, and the output of this comparison will become work performance information which is useful to the project team.
Organizational Process Assets
- Schedule control-related policies, procedures, and guidelines (usually contained in the Schedule Management Plan)
- Schedule control tools that the company has developed (a software program like Microsoft Project created by another company is considered to be an Environmental Enterprise Factor).
- Monitoring and reporting methods to be used (also usually contained in the Schedule Management Plan).
Control Schedule: Tools and Techniques
Data Analysis Techniques
- Earned value analysis–this is a technique which takes a measure of the triple constraints of scope, time and cost, and in the case of either the schedule variance or schedule performance index, can give you an idea if you are ahead, behind, or on schedule
- Iteration burndown chart–in agile methodology, this charts the remaining work to be completed in the iteration backlog (see Figure 6-24 on p. 226 of the PMBOK Guide for an example), and a trend line is calculated to forecast completion based on the remaining work. This replaces earned value analysis as a form of variance and trend analysis used in agile environments.
- Performance reviews–these are not HR reviews of the personnel on the team, but rather reviews of the performance of the project as compared to the schedule baseline.
- Trend analysis–reviews project performance over time to determine whether it is improving or deteriorating. Even if the project is not behind schedule now, it may be at some point in the future if a negative trend continues. In this case, a preventive action might be recommended.
- Variance analysis–this is not just the detection of a variance between the actual work done and the work scheduled to be done, but if there is a variance, the source of that variance is investigated. This will suggest a possible corrective action to bring the project back on schedule.
- What-if scenario analysis–there may be positive opportunities listed in the risk register which, if pursued, may bring the actual performance of the project back to the schedule model.
Critical Path Method
- If activities are showing a delay compared to the schedule, it is important to identify whether they are on the critical path. If they are, then there is a risk that the schedule deadline may be delayed, and it is very important that these activities on the critical path be brought back into line with the schedule model.
Project Management Information System (PMIS)
- The software used to create the schedule is a tool which can also be used to alter the schedule if necessary.
Resource Optimization
- Resource leveling and resource smoothing are techniques which adjust the duration of activities to fit the constraints of the workplace (8-hour workdays for example) and of the individuals themselves (some may only be able to work for a few hours per day). If activities have to be adjusted as a corrective or preventive action, it may be necessary to take into consideration the resource optimization techniques.
Leads and lags
- If there are two activities that occur one after the other, and there is a need to shorten their duration, it may be possible to move the start date of the successor activity back, in other words, to create a certain lead time so that the start date of the successor activity happens while the predecessor activity is still going on. This is actually a schedule compression technique (see next paragraph), and can be used as a corrective or preventive action to bring the work back on schedule.
Schedule compression
- If there is a delay in some of the activities related to a particular work package, one of the corrective actions required may be shorten the duration of the remaining activities, and schedule compression may be a way of accomplishing this, either by crashing (adding resources to the activities) or fast-tracking (taking the successor activity and advancing the start date so that it is done partially in parallel with the predecessor activity).
- With these techniques, the outputs of the process will be information that can be turned into reports to the stakeholders. If variances are detected, an analysis of them during this process may result in possible change requests to bring the work of the project back on schedule.. These outputs of this process will be discussed in the next post.
Control Schedule: Outputs
Work Performance Information
- The work performance data on the work actual done in the last reporting period is the input to this process. The process compares that work done to the work that was supposed to be done, and the result of this comparison is work performance information, such as a schedule performance index (SPI) or schedule variance (SV) measurement.
Schedule Forecasts
- Earned value measurement can forecast the amount of time it will take to finish the project. For example, let’s say you are halfway done with a project that should take 10 weeks. If you have a schedule performance index of 0.9, that means your project is being worked at a 90% level of efficiency, which roughly speaking means that your project will take 10/0.9= 11.1 weeks to complete if you work at the same pace. These schedule forecasts, as well as the work performance information, are inputs to the general integration process 4.6 Perform Integrated Change Control, which will turn them from work performance information that is useful for the project team to work performance reports which distill that information so that it is useful for stakeholders.
Change Requests
Every monitor and control process has as a possible output a change request, which can take the following forms:
- Defect repair (for defects that have already occurred, but are just being detected now in the current reporting period)
- Corrective action (for defects that have recently occurred in the last reporting period)
- Prevention action (for defects which may occur in the future if current trends continue)
- Changes in schedule management plan–rather than changing the work to fit the plan, if you discover that the plan was unrealistic to begin with, it may be necessary to change the plan.
Project Management Plan Updates
- Schedule management plan–the schedule management plan may be updated if there is a change in the way the schedule is managed, discovered as a result of this process.
- Schedule baseline–if change requests are approved, then the changes will be reflected in the schedule baseline; additional baselines such as cost and performance measurement may also be affected.
Project Document Updates
Integration Knowledge Area
- Lessons learned register–if effective techniques for monitoring the schedule, or discovering the causes of variances, are discovered in doing this process, these lessons are added to the lessons learned register
- Assumption log–if the cause of variance is discovered, this may change the assumptions in the assumptions log that affect the schedule
Schedule Knowledge Area
- Basis of estimates–if this process uncovers any revision in any of the schedule estimates, this may need to be reflected in an update to this document
- Schedule data–if there are modifications to the schedule recommended as a result of this process, the project schedule network diagrams may need to be changed.
- Project schedule–any alterations in the schedule data, if plugged into the schedule model, may result in changes such as the forecast finish date of the project.
Resource Knowledge Area
- If some of the techniques of this process such as resource optimization (resource leveling and resource smoothing) and schedule compression (crashing and fast-tracking) cause changes in the resource calendars, these are updated as a result of the process.
Risk Knowledge Area
- Risk register–fast-tracking is a schedule compression technique which, if used as part of this process, may increase the risks of rework for the activity to which they are applied. These risks need to be updated in the risk register.
- The outputs then feed into the general monitoring and controlling process 4.6 Perform Integrated Change Control. (All the separate knowledge area monitoring and controlling processes do so, by the way, not just the processes for the schedule knowledge area.)’
- This concludes the posts for the schedule management knowledge area. The next post will start the next knowledge area, that of cost management.
Consideration Points
Consideration Points
- control mean measure project against the plan project manager need to stay in control of project and know how its performing compared to the planning
- project manager dos NOT have to spend most of his time dealing with problems , since these problems supposed to be prevented through risk management
- project and project manager will be considered as failure if schedule baseline has NOT be met
- project control also could mean look at factor causing change and influence the source of change (proactive and preventive )
- if project manager realize that project can NO longer meet (approved ) schedule baseline , he should terminate project before wasting company time
Control Schedule : Process activities
some actions could be involved in control schedule process :
- review current work performance data
- re-estimate the remaining project activities based on current performance data
- perform trend analyses of project performance
- consider resource optimization
- identify the need of change (preventive , corrective , defect repair )
- review project reports to capture information needed to control and manage project
